Consumer Price Index (CPI): Methodology & Blind Spots(2025)
Key Revisions to CPI Methodology (2020–2025)
-
Modernized Basket:
- 2023 Weighting Adjustments: Reduced food (32% → 25%), increased housing (17% → 23%), added tech services (5%).
- New Categories: Ride-hailing (3%), streaming subscriptions (2%), private healthcare (4%).
-
Regional Differentiation:
-
Data Transparency:
Persistent Issues with CPI Accuracy
| Factor |
CPI Underestimation (2025) |
Real-World Impact |
| 🏠 Housing Costs |
4.0% in Tier 1 cities
Official CPI: 2.1%
|
Actual: 6.8% (avg. mortgage inflation) |
| 📚 Education / Healthcare |
15% nationally
Official CPI underweights both sectors
|
Private school fees rose 12% YoY (vs. CPI’s 3%) |
| 🍔 Food Delivery / Takeout |
Excluded until 2024
Now included in 2025 basket
|
20% of urban food budgets historically uncaptured |
| 📊 Key Takeaway: Official CPI inflation consistently understates real household cost increases, particularly in housing, education, healthcare, and newer consumption categories like food delivery. |
Why CPI Still Matters in 2025
- Policy Benchmark: PBOC uses core CPI (ex-food/energy) for interest rate decisions.
- Regional Planning: Identifies poverty-alleviation targets (e.g., Western China CPI = 1.5% vs. real ~2.4%).
- Wage Adjustments: Minimum wage hikes tied to CPI in 18 provinces.
Vizualizing the Data
1 Regional Inflation Disparities (2025)
Key Insight: Tier 1 cities show 3–5% underestimation.
2 CPI Basket Weighting Changes (2000 vs. 2025)
Key Insight: Housing/Healthcare doubled, food halved.
3 Monthly CPI Trends (2020–2025)
Key Insight: Tier 1 cities consistently 3–4% above official CPI.
Core Under-reporting Issues
-
The Housing Mirage
- Official CPI weight: 23%
- Real urban expenditure: 38-42%
- Example: Beijing homeowners face 8.5% actual housing inflation vs reported 2.3%
-
Education & Healthcare Black Box
| Category |
CPI Weight |
Estimated Reality |
Underreporting |
| Private Education |
4% |
11% |
7 pp |
| Healthcare |
9% |
17% |
8 pp |
-
The Takeout Trap
- Food delivery (added 2024): 3% weight
- Actual urban spending: 9-12%
- Data gap: Meal delivery prices rose 18% in 2024 (CPI food: +5.2%)
Visualizing the Data
1. Food vs. Non-Food Inflation (2020–2025)
Key Insight:
- Food inflation remains volatile (peaked at 10.5% in 2020).
- Non-food CPI understates reality by 3–4 percentage points.
2. Urban vs. Rural Inflation Disparities (2025)
Key Insight:
- Urban housing inflation is 3× higher than reported.
- Rural food inflation outpaces urban (4.2% vs. 3.7%).
3. Core CPI vs. Headline CPI
Key Insight:
- PBOC relies on core CPI (avg. 1.4% in 2025) for monetary policy.
- Headline CPI masks volatility in food/energy (peaked at 5.4% in 2020).
4. Urban CPI vs Reality (2025)
5. The Evolving CPI Basket
Why This Matters in 2025
-
Policy Consequences
- Interest rates kept artificially low
- Social benefits adjustments lag real costs
- Regional development funds misallocated
-
Business Impacts
- Consumer market sizing errors up to 20%
- Salary negotiations increasingly contentious
- Retail pricing strategies distorted
-
Hidden Inflation Hotspots
- Elderly care costs rising 12% annually (uncaptured)
- EV charging fees up 35% since 2023 (new category)
- Pet care services (urban millennials spend 5%+ of income)
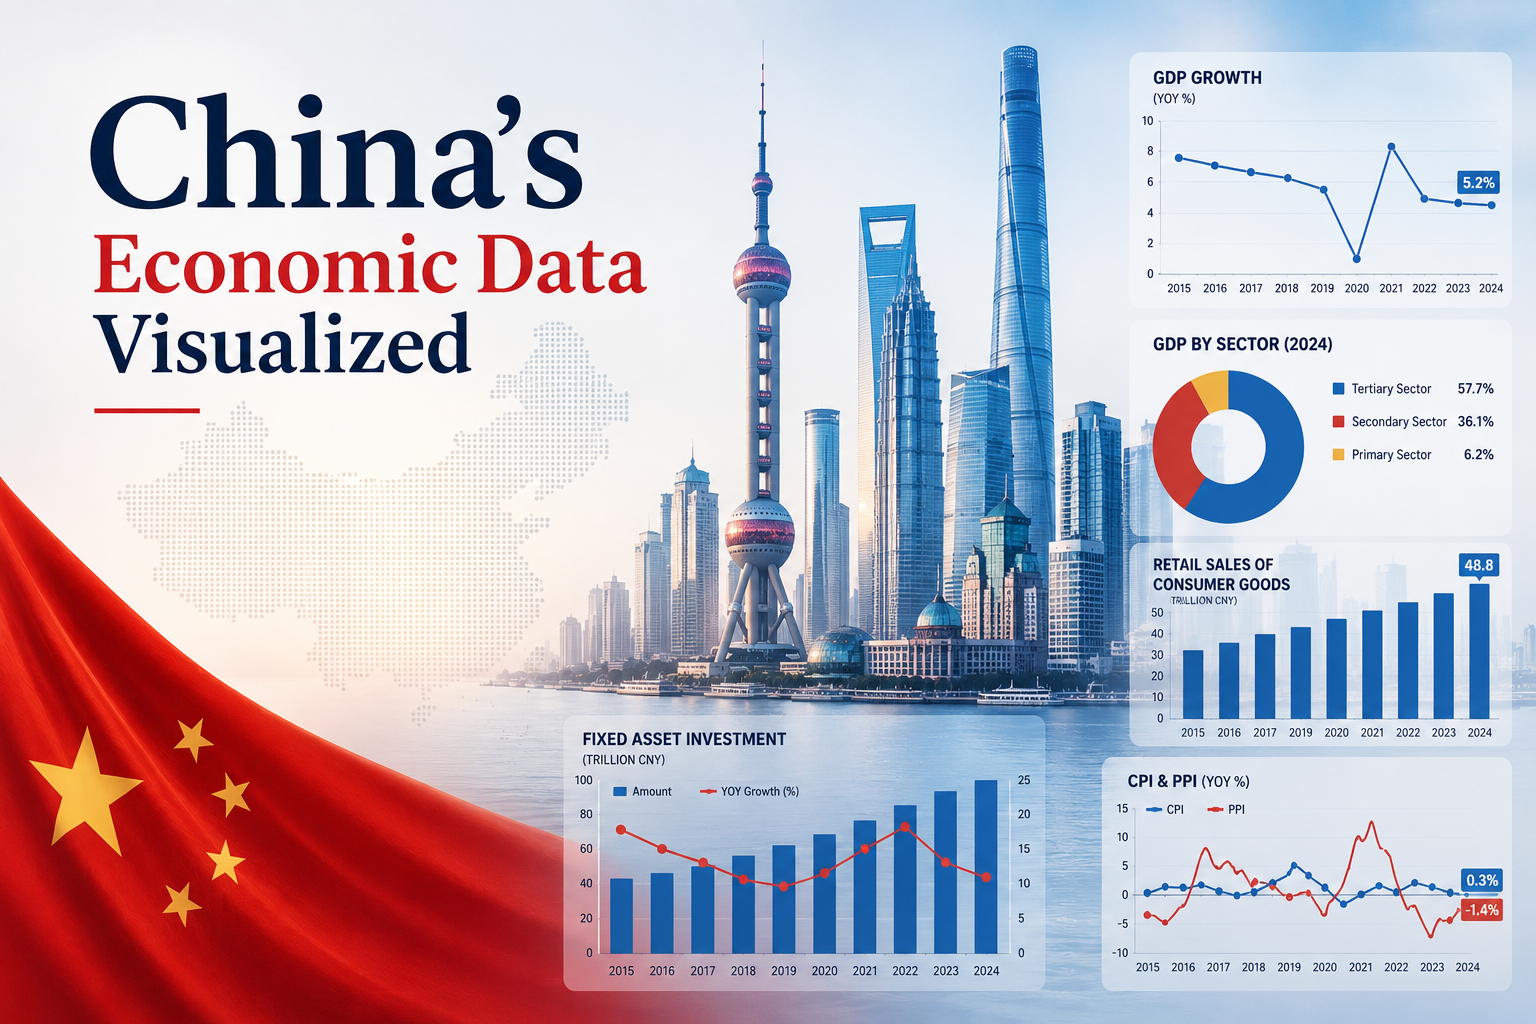
Return to: China’s Macro Data Visualized
Explore: Cityscape Investment Series
Explore: Regional Economic Overview Series
Explore: China Logistics Reports